By Harrison Jones, ASA
The increasing availability of big data and the use of predictive analytics are changing how insurers and actuaries operate. For many, the question of what to do with this complex raw material has become a key organizational challenge.
As companies face growing competitive pressures to perform, knowing how to mine and recognize the importance of data, in all forms, becomes a prime advantage.
Gleaning insights via social media
Social media platforms like Twitter, Facebook, and Instagram are used around the world for many purposes. One interesting side effect of this phenomena is there now exists significant amounts of data to be analyzed.
As an example of how to analyze this data, we have used the CIA’s English Twitter feed to show how even the most basic text analytics can provide valuable business insights. All historical tweets from @CIA_Actuaries have been extracted using the rtweet R package and subsequently analyzed using the dplyr, ggplot2, and quanteda packages.
Disclaimer: This article does not discuss the ethical use of data, but this should certainly be considered by businesses who choose to leverage public or private data sources, including data from Twitter.
Tweet frequency
The first tweet sent by @CIA_Actuaries was on February 24, 2012, and it read “@ICA_Actuaires Welcome to Twitter!”, welcoming its French counterpart. Since then, @CIA_Actuaries has tweeted 2,801 more times as of March 1, 2021. Figure 1 shows the number of tweets posted by year and by month.
Figure 1: Number of tweets by year and by month from @CIA_Actuaries

The number of tweets per-year trended upwards until a peak in 2019, then a sharp drop in 2020. COVID-19 might have played a role in the reduction in tweet frequency in 2020, in addition to changes in the social media strategy of the Institute. In the first two months of 2021 @CIA_Actuaries has tweeted 30 times (an annualized amount of 180 times), indicating that the trend of a lower frequency of tweets could continue.
On a month-by-month basis we see dips in December and during summer months, which makes sense as those coincide with vacations and holidays. We also see a significant increase in tweet frequency in June, which is supported by the fact that the CIA annual conference typically happens during that month.
Retweets
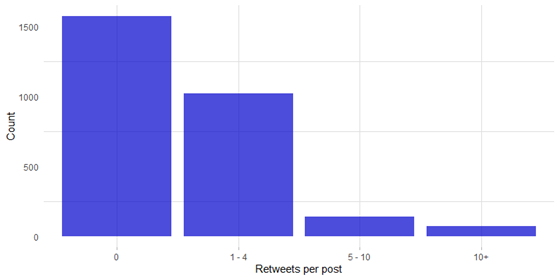
1,230 of @CIA_Actuaries tweets have been retweeted (less than half of all tweets) but if you look at the average retweet count it is unusually high at approximately 24 retweets per post. Two tweets are skewing the average: both are from Bell Let’s Talk Day, where donations are based on the number of tweets/retweets. Besides those two outliers, an interesting question for the CIA team to explore would be which posts lead to a retweet and why.
Figure 2: Number of retweets per post from @CIA_Actuaries
Hashtag frequency
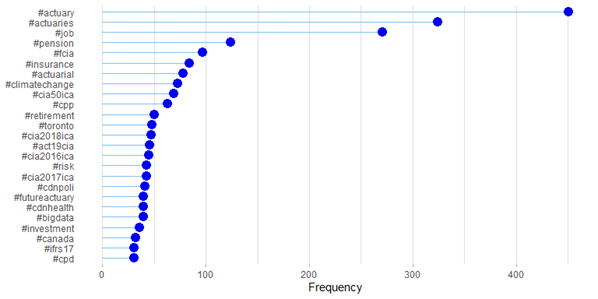
Figure 3 identifies the hashtags that are used most frequently by @CIA_Actuaries. Unsurprisingly, the two most common are #actuary and #actuaries. Some other interesting trends can be seen:
- #pension is used more than #insurance and three of the top eleven hashtags appear to relate to pension actuarial (#pension, #cpp, and #retirement).
- #toronto is the most commonly used hashtag for cities.
- emerging fields like #climatechange and #bigdata make the top 25 list.
Figure 3: The top 25 hashtags used by @CIA_Actuaries
Tweet wordclouds
Figure 4 and Figure 5 display (non-hashtag) words that @CIA_Actuaries most commonly uses. The word clouds show that the common non-hashtag words used are very similar to the hashtags used. For example, #actuary and “actuarial.” It’s also evident that @CIA_Actuaries references other organizations in tweets (e.g., SOA, ASNA).
Figure 4: Most common words used by @CIA_Actuaries
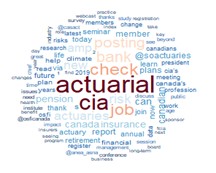
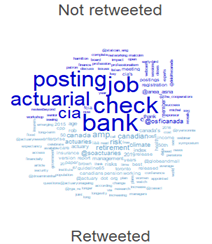
Figure 5 is divided into the most common words in posts that are retweeted (in light blue) and the most common words in posts that are not retweeted (in dark blue). The most obvious trend is that the words “job,” “posting,” and “bank” (perhaps in reference to job banks) often result in no retweets.
Figure 5: Most common words used by @CIA_Actuaries split by posts that were retweeted vs. not retweeted
Sentiment
Sentiment analysis is a technique that assigns a score to a collection of words, such as a tweet, and can measure whether the collection of words is generally positive or negative. For example, the sentence “Pension plans help Canadians” has a positive sentiment. The sentence “Pension plans don’t help Canadians” has a negative sentiment.
The Lexicoder Sentiment Dictionary is used for defining the sentiment of words and applied to all of @CIA_Actuaries tweets. The number of positive/negative words are then counted for each month. Figure 6 and 7 display the results.
Figure 6: Sentiment score for @CIA_Actuaries by month
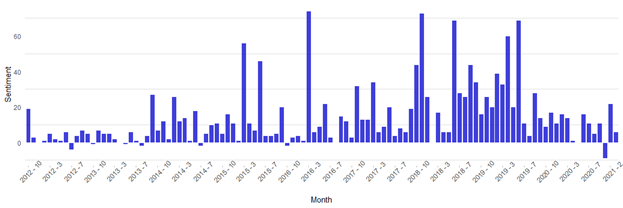
The texts from @CIA_Actuaries are generally quite positive. There have only been a few months on record with negative sentiment, and even then the it is quite low.
Figure 7: Positive and negative word count for @CIA_Actuaries by month
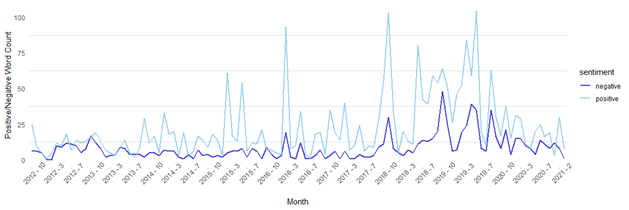
Figure 7 shows the same results as Figure 6 but in a different format. In Figure 6, the sentiment score is equal to positive word count subtract negative word count.
Concluding thoughts
From this small data set we are able to:
- identify the sentiment of tweets from the Institute (and how their sentiment trends over time) towards certain topics or issues;
- evaluate how their often-used hashtags are received by their audience; and
- determine whether certain words or hashtags trigger positive / viral responses from followers.
The example of @CIA_Actuaries is a productive exercise. While not meant to provide specific value for actuarial practitioners, it demonstrates how intuitive insights can be derived from social media data. A similar approach could be leveraged for insurance companies as well.
The ability to capture, quantify, and analyze data meaningfully helps better predict outcomes and exercise sounder, faster, more actionable judgment. As data becomes a key driver for economic growth, once an afterthought for business enhancement, social media now presents an overflowing reservoir of opportunity.
Further reading
- quanteda R package: https://tutorials.quanteda.io/
- rtweet R package: https://github.com/ropensci/rtweet
- R for Data Science: https://r4ds.had.co.nz/
Don’t forget to stay in touch with the CIA on social!


